Monitoring
From the Monitoring page experts can check the energy consumption of the system in the form of an energy graph for the whole project, monthly energy consumption comparisons by group, and by generating energy reports in the form of .csv files. Experts can also monitor device health status for failed or degraded devices.
Energy consumption
Energy consumption is measured in real-time by each SR driver, SR bridge, wireless driver, switch relay and Smart T-LED. It is measured cumulatively from day one and has a maximum of 4% inaccuracy. Energy consumption is reported every 15 minutes over Zigbee from each device in a wireless network to its respective gateway and is then sent to the cloud and aggregated per group.
| Energy data is accumulated within each device, which reports the total to the system. As a result, immediately after adding the gateway(s) to the system, you will likely notice an unusually high energy consumption displayed. This reflects the accumulated energy consumption data being reported initially to the gateways and does not reflect the current energy consumption. After this initial spike in energy consumption, the following readings will level out and reflect the incremental energy consumption of the system. |
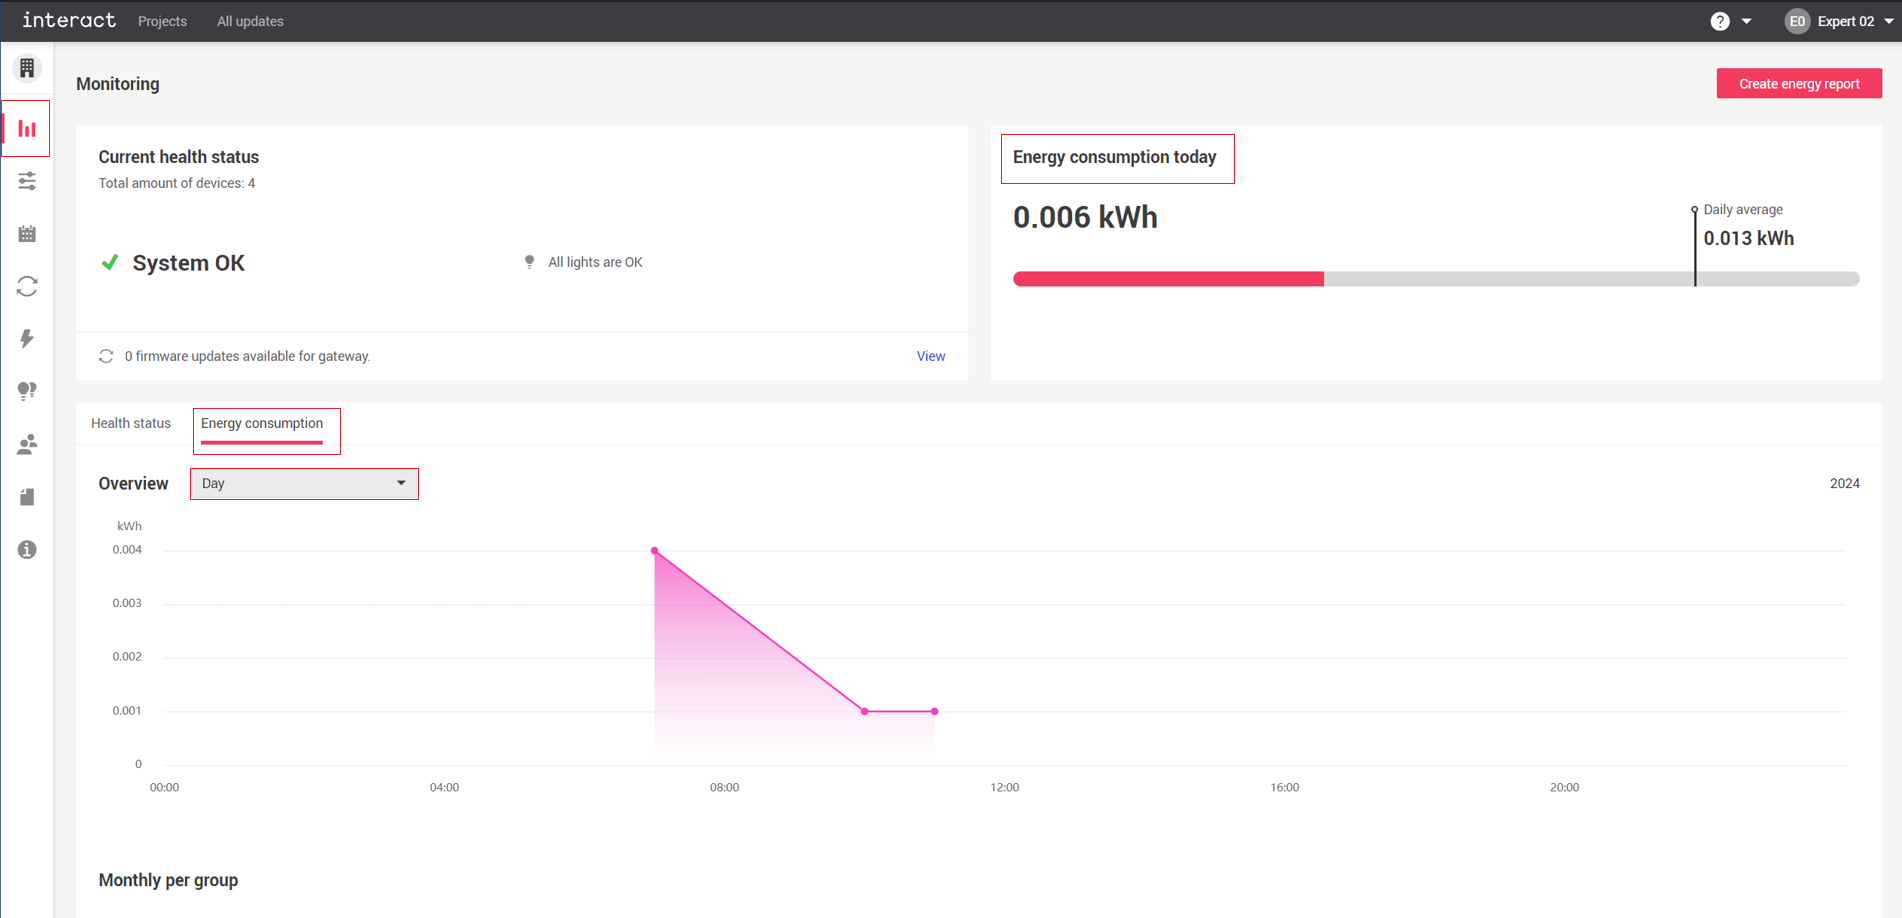
Energy consumption graph
The Energy consumption graph gives you a visual illustration of energy consumption for the entire project.
-
To see the graph, navigate to your project. The Monitoring page is displayed by default. If you navigate elsewhere in the project, click the Monitoring icon from the side panel to return to the page.
-
Go to Energy consumption, where the graph displays the consumption of energy by the luminaires that are present in the network (only with a gateway).
-
Use the drop down filter to view historical energy consumption by day (current day), week (current week starting from Monday), month (current month starting from 1st day of month) or year (current year starting from January 1).
-
The current day’s energy consumption compared to the daily average can also be viewed in the Energy consumption today area of the Monitoring page.
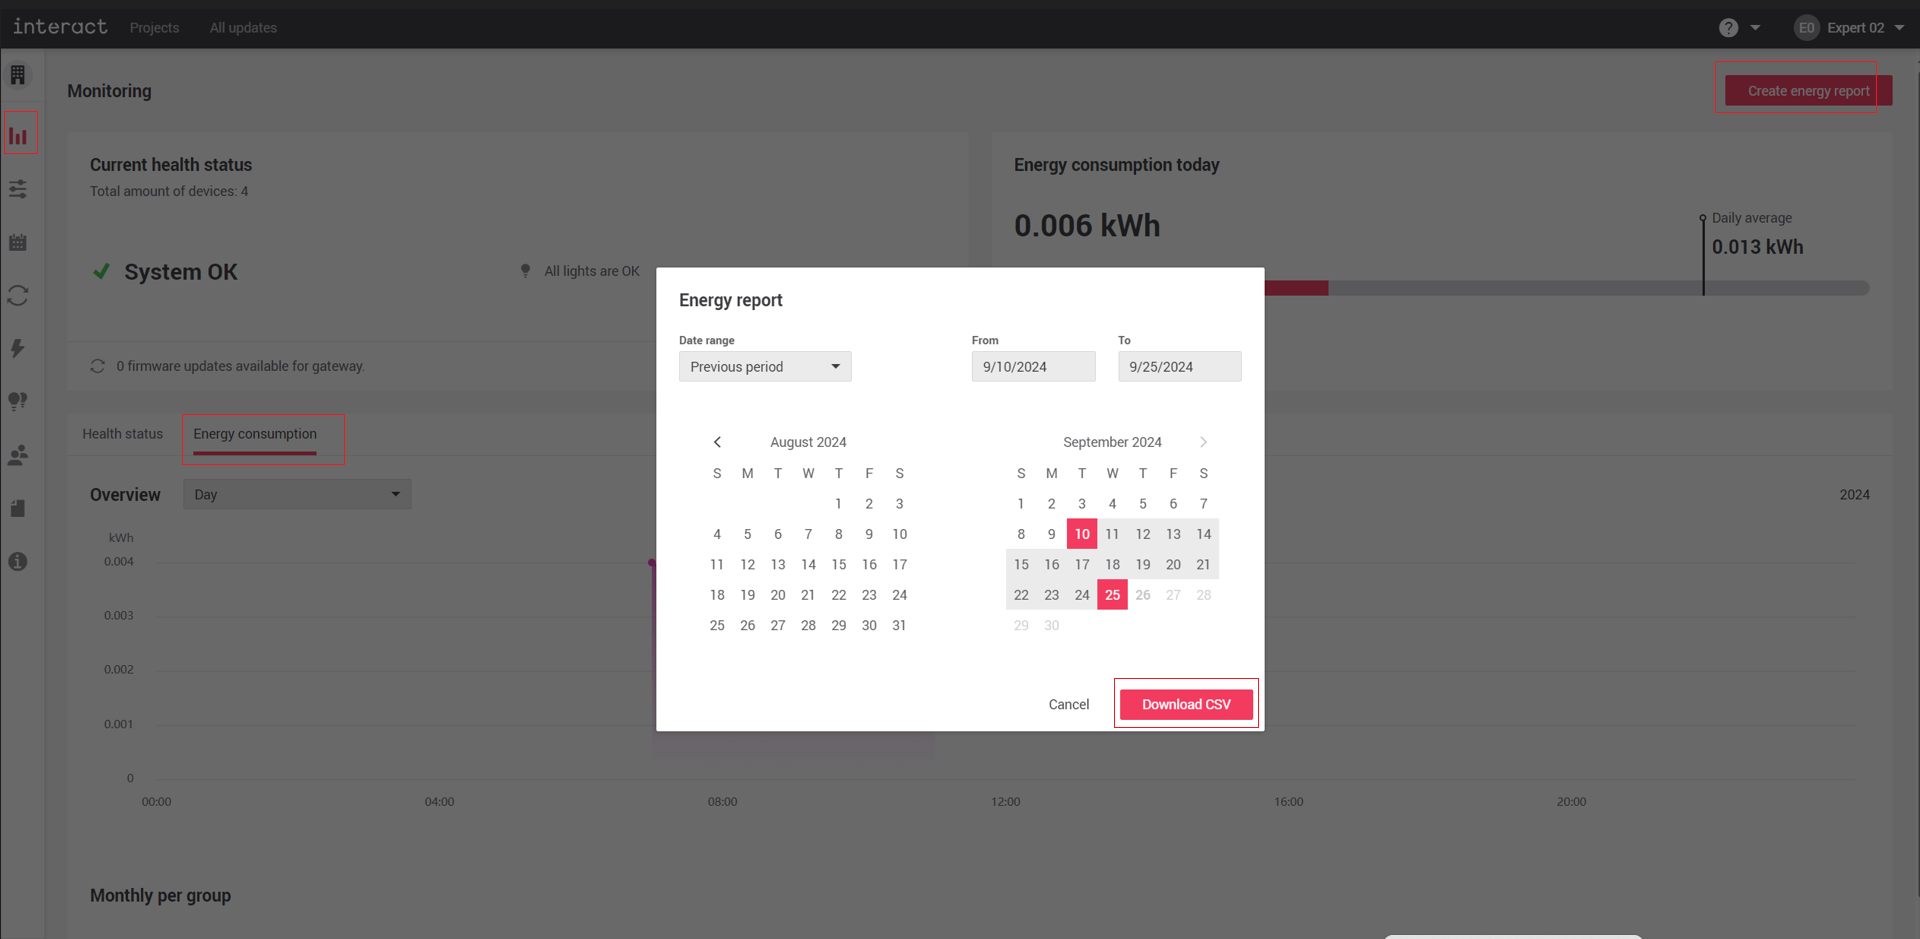
Create energy report
An energy report can be generated to a .csv file that can be downloaded. This report can be generated from a maximum of one year prior to the date it is generated up to the day before the report is generated. Depending on the size of the project (# of groups) and the duration period of the report, this can generate a lot of data, because every group in the project reports incremental energy consumption every 15 minutes. So for example, a project with 100 groups in it will generate 9600 rows of data per day (100 groups x 4 reports/hr x 24 hrs/day).
To create an energy report:
-
Navigate to your project. The Monitoring page will load by default.
-
Click the Create energy report button on the top right.
-
A calendar date picker appears on the page. Choose the From and To dated, then click Download CSV.
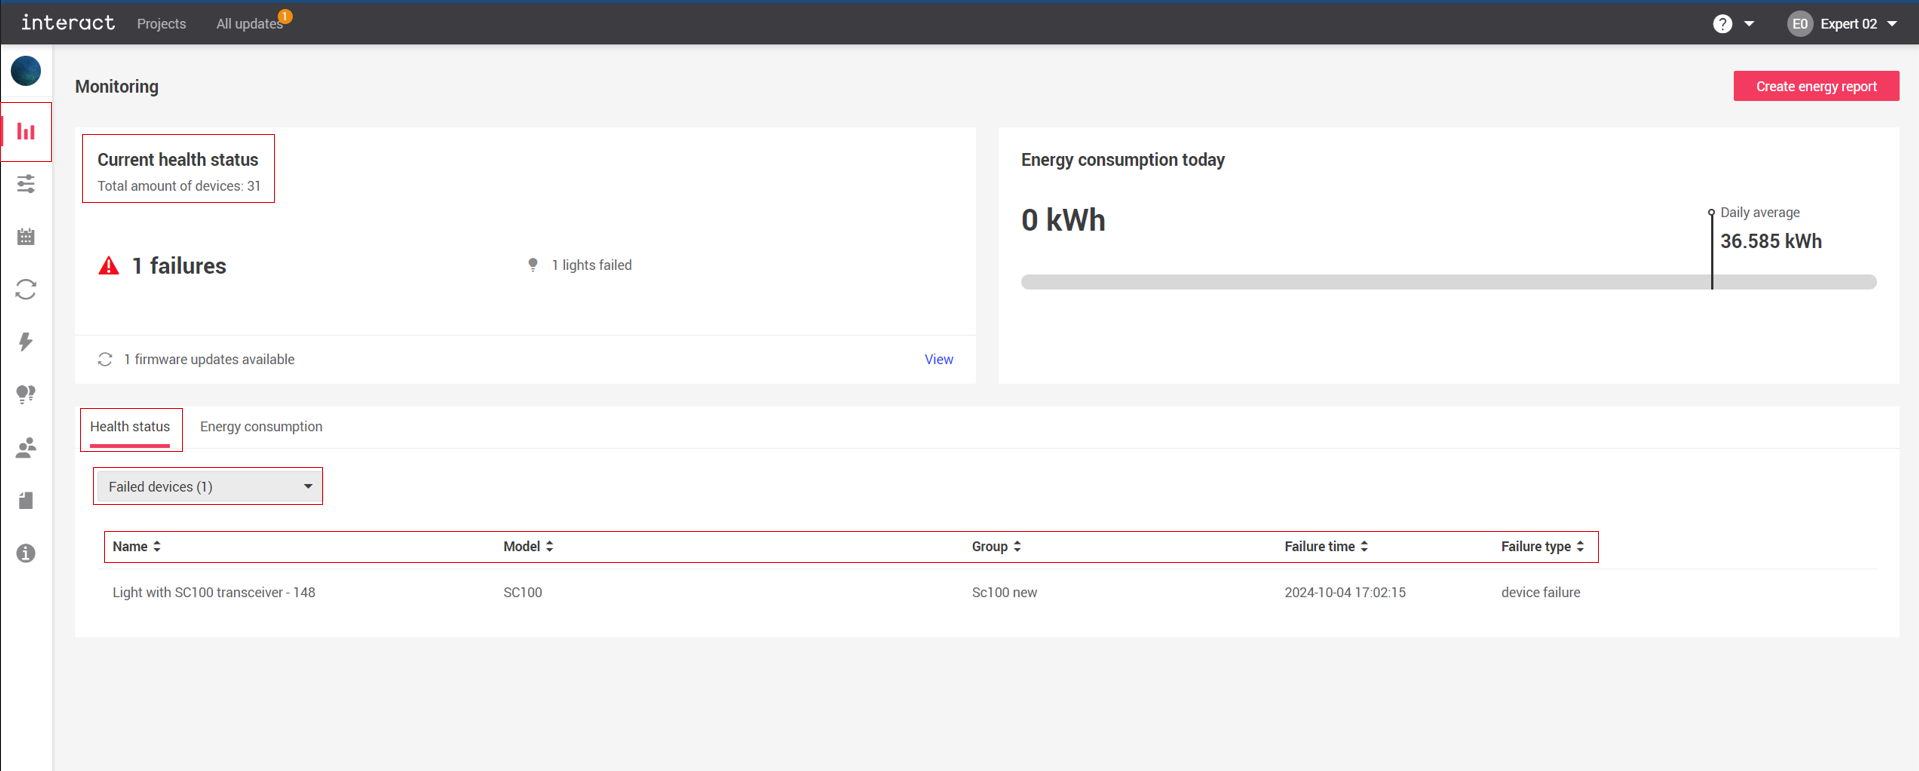
Device health status
From the Monitoring page dashboard, users can see the functioning status of the devices in the project. Under Current health status, you can see the total number of devices in the project, under which you can see the details of failed devices (if any). Clicking Health status from the table below will display any Failed devices (devices reporting a failure code to the system) by device name, model, group, failure time and the failure type. There is also a drop down filter to display Degraded lights. Degraded lights report any lights that are at 80% or more of the burning hours of their intended lifespan and are displayed by device name, model, group, burning hours and lifespan.
| All lights can report a failure/alert. The failure/alert is mainly about driver or LED board malfunction, e.g. short circuit. There are multiple failure types per device, which depends on the device capability of failure detection (mainly hardware or wiring problems). |
-
Navigate to the project. The Monitoring page is displayed by default.
-
Click Health status.
-
Click the drop down filter to choose to view Failed devices or Degraded lights are seen.
-
If a luminaire’s burning hours is over 80% of its lifespan, it will be categorized as Degraded light, even if it is functioning well.